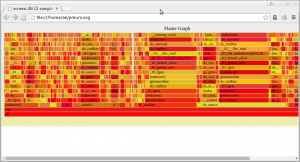
Generating Flame graphs with Processor Trace
How to generate a FlameGraph with Processor Trace. Everybody loves Flame Graphs.
Processor trace allows to do as very exact histograms of a program’s run time. Normal sampling has shadow effects, which can hide some details. Processor traces every branch, so it can be much more accurate than normal sampling.
You need a Intel Broadwell or Skylake CPU.
Running at 4.1 or later Linux kernel where perf supports PT.
You can verify the kernel supports pt with
ls /sys/devices/intel_pt
You need perf user tools built from https://github.com/virtuoso/linux-perf
(this should soon be fixed when the user tools code is merged into Linux mainline)
Build perf with PT support
# set up https_proxy as needed

git clone https://github.com/virtuoso/linux-perf

cd linux-perf/tools/perf

make
Copy the resulting perf binary to where you want to run it
Get the flamegraph code
git clone https://github.com/brendangregg/FlameGraph.git
.
Collect data from the workload. Best to not collect too long traces as they take much longer to process and may need too much disk space.
perf record -e intel_pt// workload (or -a sleep 1 to collect 1s globally)
Decode the data. This may take quite some time
perf script --itrace=i100usg | /path/to/FlameGraph/ | stackcollapse-perf.pl > workload.folded
The i100us means the trace decoder samples an instruction every 100us. This can be made more accurate (down to 1ns), at the cost of longer decoding time. The ‘g’ tells the decoder to add callgraphs.
Then generate the Flamegraph with
/path/to/FlameGraph/flamegraph.pl workloaded.folded > workload.svg
Then view the resulting SVG in a SVG viewer, such as google chrome
google-chrome workload.svg
It is possible to click around.
Here’s a larger svg example from a gcc build (2.5MB). May need chrome or firefox to view.
In principle the trace also has support for more information not in normal sampling, such as determining the exact run time of individual functions from the trace. This is unfortunately not (yet?) supported by the Flame Graph tools.
